Radioactivity is an exciting, mysterious and scary part of physics for many students, often because their ideas about 'radiation' are closely associated with their ideas about superheroes. Frequently my class discussions with students to gauge their prior knowledge about radiation and radioactivity come round to Stan Lee's Marvel Comics creations - 'Spiderman' and 'The Incredible Hulk'.
After explaining that these are works of fiction, with little basis in fact, it was for many years traditional to then introduce students to the realities of radioactivity using Geiger-Muller (GM) tubes, scaler-timers, a range of radioactive sources and absorbers. These allowed teachers to demonstrate the nature of the three types of radiation, their random nature, range in air, and the materials required to absorb them.

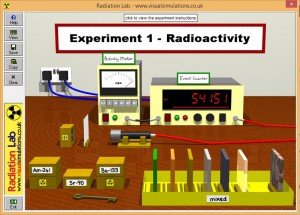
These days fewer schools have radioactive sources - they are expensive to buy, require careful storage and handling and must be regularly checked to ensure they are safe to use. As a consequence of this many students never see this equipment being used, and are more likely to see an interactive virtual demo, such as 'RadiationLab' from Visual Simulations.
Of course, there are plenty of YouTube videos that will also get these points across, but they're still not the same as students seeing these effects with their own eyes. As I work in a school with no radioactive sources, I have had to make extensive use of videos and software simulations to demonstrate the properties of the three types of radiation. I always go to the trouble to show students the apparatus, as much to allow them to see the real kit, but also because it allows us to detect and measure background radiation.
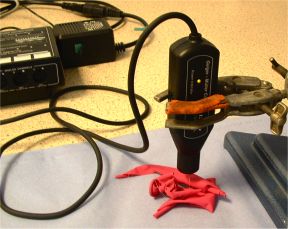
In the last week I performed an experiment I read about a number of years ago in a SSERC bulletin, which uses an electrostatically charged balloon to attract radioactive particles from the air onto its surface. This experiment is detailed HERE on their website.
(reproduced with permission of SSERC)
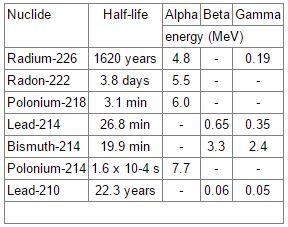
The charged balloon accumulates decay products from the Uranium/Radium decay sequence, which in turn decay as shown in the table below.
(reproduced with permission of SSERC)
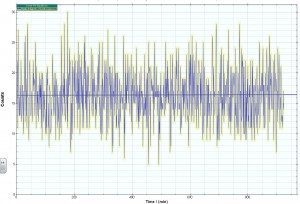
Whilst the balloon is collecting radionuclides, the apparatus - a djb Microtech ALBA interface and GM tube - was used to measure the background radiation. The graph produced clearly shows the random nature of the detected background radiation, which averaged out at a level of 16.3 counts per minute.
Background radiation graph
The balloon is burst and placed below the GM tube, then left to log the radiation over a period of a few hours. The background level is subtracted from the count obtained for the balloon and a graph of the balloon's activity can be plotted.
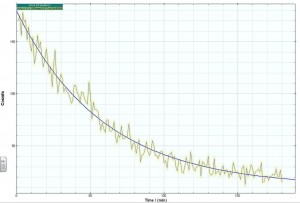
Balloon radiation graph
Again the raw data fluctuates greatly, reflecting the randomness of the decay process, but it clearly shows an elevated level of activity, around ten times greater than background. Using the software's built-in line fitting algorithm, an exponential decay curve was fitted to the data.
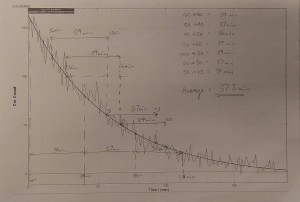
A copy of this graph was given to each pupil, and used to determine the half-life of the radiation detected from the balloon.
Analysed graph
Having measured the time for a number of sections of the graph where the measured activity had reduced by half, pupils then calculated a mean value for the half life of 37.3 minutes. This is most likely a combination of the decays of Pb-214 and Bi-214.
For those with ALBA interfaces and software, but without the GM-tube, I would be happy to provide you with the raw .atb files for use with your own classes. These could not be uploaded to this blog, but can be accessed HERE via Google Drive.
This is a great way to have the students not only see some radioactive decay but also become more familiar with how ubiquitous it is. Thanks for the write up!
I wonder: If some of the decays are beta decays, does the overall charge of the balloon change appreciably? Could you measure that to overcome not having a GM tube?